How do I read this graph?

This forum made possible through the generous support of SDN members, donors, and sponsors. Thank you.

mariposas905

Full Member
5+ Year Member
Joined
Mar 14, 2017
Messages
1,664
Reaction score
647
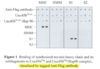
This is a graph from EK Biology Book 1, Lecture Exam 1, Passage 1. Its apparently an autoradiography graph, but I have no idea how to even read it. Are they doing three trials of each experiment? For example, the first column, first row has MHC with Anti-flag antibody and three +'s. Does this mean MHC was mixed with Anti-flag antibody for three different trials and they bound together with each trial?

Also, how can I look at this graph (without reading the passage) and determine the basic results of the experiment? I know that scientists who read research papers routinely look at the figures to get the gist of the experiment and I'm wondering how this is done.

So confused!!!

Members don't see this ad.
 

Attachments

  • Screen Shot 2017-06-20 at 9.34.40 PM.png
    Screen Shot 2017-06-20 at 9.34.40 PM.png
    381.7 KB · Views: 54
To understand this graph, you have to be familiar with standard molecular biology techniques. So MHC and myosin are both proteins. In order to visualize proteins, biologists tag that protein with a ligand that binds to that protein with high affinity. Usually, that ligand also isn't detectable, so they attach some other modification to the ligand to make it detectable. That modification is then strongly bound by some radioactive or fluorescent tag. In this case, they're taking some sample of MHC and binding this Unc ligand to it. Attached to that UNC ligand is a FLAG tag and that FLAG tag can then be bound by the anti-FLAG antibody, which gives you the signal that you see on the plate.

The pluses and minuses denote whether each of those components were present. So for instance, in the first column, they treated with anti-FLAG but no ligand. Since there's no ligand, there's no FLAG tag and thus nothing for the anti-FLAG antibody to bind to. So it'll just wash away and not give you any signal. This is a control.
 
  • Like
Reactions: 1 users
To understand this graph, you have to be familiar with standard molecular biology techniques. So MHC and myosin are both proteins. In order to visualize proteins, biologists tag that protein with a ligand that binds to that protein with high affinity. Usually, that ligand also isn't detectable, so they attach some other modification to the ligand to make it detectable. That modification is then strongly bound by some radioactive or fluorescent tag. In this case, they're taking some sample of MHC and binding this Unc ligand to it. Attached to that UNC ligand is a FLAG tag and that FLAG tag can then be bound by the anti-FLAG antibody, which gives you the signal that you see on the plate.

The pluses and minuses denote whether each of those components were present. So for instance, in the first column, they treated with anti-FLAG but no ligand. Since there's no ligand, there's no FLAG tag and thus nothing for the anti-FLAG antibody to bind to. So it'll just wash away and not give you any signal. This is a control.

Oh, I think I get it now...I was reading the graph horizontally and wondering what on Earth all the +'s meant since there was only one MHC at the top (and not three different categories). So you're saying I need to read it vertically?

So for the first sub-column in the first column, Anti-flag was added without Unc45b or the Unc45b/Hsp90 complex...so there was no signal (or thick band) at the bottom.

This means that there was no visualization, so there was no binding involved? And if there is no binding involved, then there is no reaction? So basically, a thick band on the graph means the researchers' hypothesis was correct?
 
@aldol16 Also, doesn't anti-FLAG antibody mean that it doesn't want to bind FLAG (since it's "anti") ? How can this anti-FLAG antibody bind to the FLAG tag like you mentioned?
 
So for the first sub-column in the first column, Anti-flag was added without Unc45b or the Unc45b/Hsp90 complex...so there was no signal (or thick band) at the bottom.

This means that there was no visualization, so there was no binding involved? And if there is no binding involved, then there is no reaction? So basically, a thick band on the graph means the researchers' hypothesis was correct?

There was no binding of Unc to MHC because they didn't incubate MHC with Unc. So there's obviously not going to be Unc-MHC binding if there's no Unc. Which means that the anti-FLAG antibody isn't going to have anything to bind to (since it binds to a FLAG tag located on Unc) and thus you don't see anything. This has nothing to do with any hypothesis. It's simply a control to see that anti-FLAG doesn't non-specifically bind to MHC. You're going to have to skim a bit to figure out what their hypothesis was for this particular experiment. My guess is that they simply wanted to see if there was binding between Unc and these parts of MHC because they were looking for the specific binding site for Unc on the protein.

@aldol16 Also, doesn't anti-FLAG antibody mean that it doesn't want to bind FLAG (since it's "anti") ? How can this anti-FLAG antibody bind to the FLAG tag like you mentioned?

You should be familiar with the terminology here. In molecular biology, an "anti-X" antibody means that the antibody will bind to X. Think of "anti-" as meaning "the other part of the whole." In other words, the anti-X antibody is the key that opens a specific lock.
 
  • Like
Reactions: 1 user
Top