EK exam 1 P/S #36

This forum made possible through the generous support of SDN members, donors, and sponsors. Thank you.

akimhaneul

Full Member
7+ Year Member
Joined
Dec 2, 2015
Messages
438
Reaction score
23
I think I'm confused about how Ek values predict the agreeableness in figure 2. Can anyone help?

Members don't see this ad.
 

Attachments

  • Screen Shot 2017-06-20 at 1.50.10 PM.png
    Screen Shot 2017-06-20 at 1.50.10 PM.png
    90.6 KB · Views: 33
  • Screen Shot 2017-06-20 at 1.50.20 PM.png
    Screen Shot 2017-06-20 at 1.50.20 PM.png
    33.9 KB · Views: 33
  • Screen Shot 2017-06-20 at 1.50.27 PM.png
    Screen Shot 2017-06-20 at 1.50.27 PM.png
    58.2 KB · Views: 22
  • Screen Shot 2017-06-20 at 1.54.51 PM.png
    Screen Shot 2017-06-20 at 1.54.51 PM.png
    101.8 KB · Views: 24
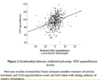
Well, they didn't actually show you how they used Ek scores to predict agreeableness. They simply stated that they did, which should be enough to rule out answer C. What Figure 2 shows is their actual scores plotted against their predicted scores. If Ek scores entirely predicted agreeableness, you would expect the slope of the line cross through zero and have a slope of exactly one. In other words, y = x, or actual score = predicted score. In this case, it looks like Ek is a rather poor predictor.
 
Top